
Economics Project on Demand CBSE Class 12
THEORY OF DEMAND
MEANING OF DEMAND
Demand means desire I want for something, but in economics, demand refers to effective demand; the number of buyers willing to purchase at a given price over a given period.
- Demand is desire/want backed by money.
- Demand = desire + ability to pay + will.
- It is always related to price and time.
- Examples; demand for oranges by a household for Rs. 50 per kg is 5 kg oranges per week.
DEFINITION OF DEMAND
The demand for a product refers to the amount of it which will be bought per unit of time at a particular price.
INDIVIDUAL DEMAND TO MARKET DEMAND
INDIVIDUAL DEMAND:
It refers to demand from individuals or families or households. It is a single consuming entity’s demand.
MARKET DEMAND:
It refers to the total demand of all buyers, taken together. It is the aggregate of the quantities of a product demanded by all the individuals at a given price over some time. It is the total of individual demand. Market demand is more important from the business point of view; sales depend on market demand.
The following table shows individual demands for eggs and how market demand for eggs at various prices is derived: –
| PRICE (Rs.) | A | B | C | D | E | Total Demand for eggs. |
| 10 9 8 7 6 5 4 | 1 2 3 4 5 6 7 | 3 4 5 6 7 8 9 | 0 1 2 3 4 5 6 | 0 0 1 2 3 4 5 | 0 0 0 1 2 3 4 | 4 7 12 18 23 28 33 |
DEMAND CURVE
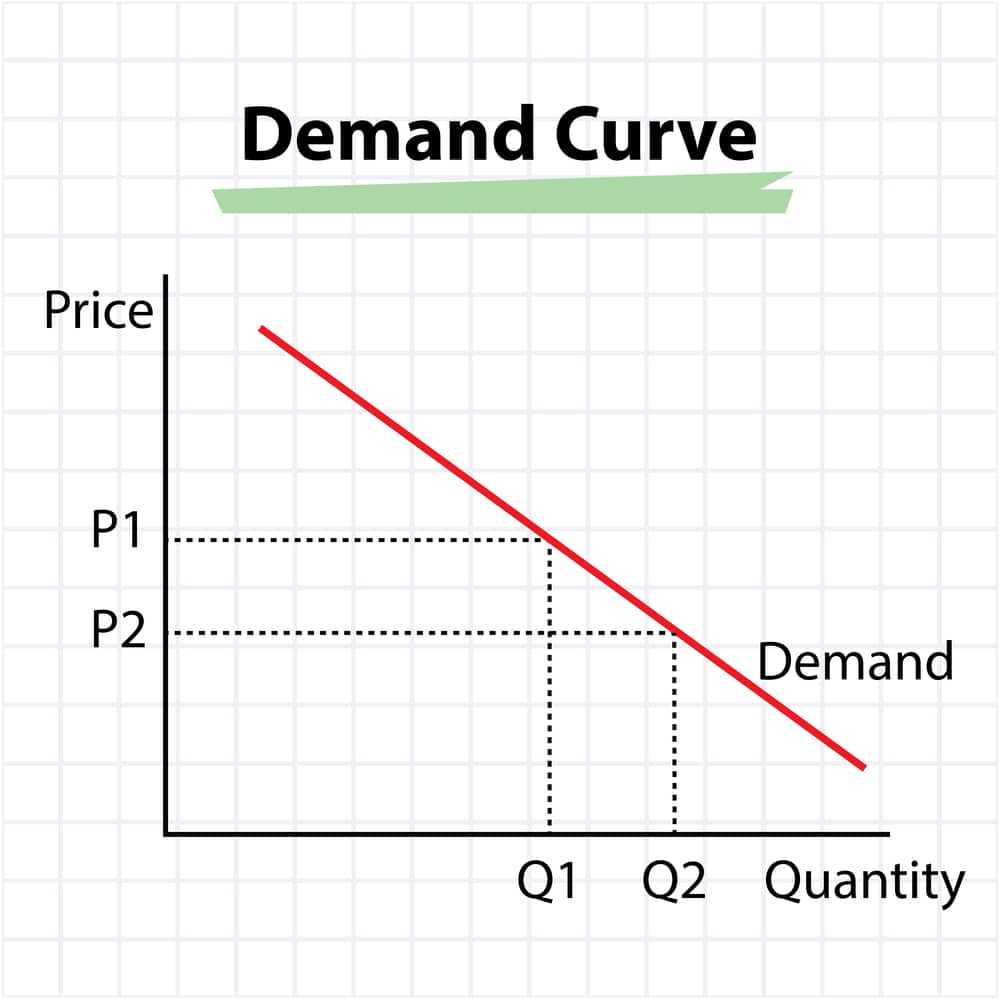
In economics, the demand curve is the graph depicting the relationship between the price of a certain commodity and the amount of it that consumers are willing to and can purchase at the given price. It is a graphical representation of a demanding schedule. The demand curve for all consumers together follows from the demand curve of every consumer.
DEMAND FUNCTION
At any point in time, the quantity of a given product that will be purchased by the consumers depends on the key variables.
- Own price of the product (P)
- Price of supplementary goods (Ps) and complementary goods (Pc)
- Level of disposable income (Ya)
- Change in tastes & preferences (T)
- Change in several buyers. (N)
Dx= f (Px, Ps, Pc, Yd, T, A, N)
where, x= Commodity
Dx= amount of qty demands
Px = price of x.
LAW OF DEMAND
The Law of demand states that all the other factors being constant, as the price of a product increases (), quantity demanded falls (¯); likewise, as the price decreased, the quantity demanded increases.
In simple words, the law of demand means the inverse relationship between price and quantity of demand. There is a negative relationship.
The remaining factors, other than the price of the product, are assumed to be constant in this relationship.
EXCEPTIONS OF LAW OF DEMAND
GIFFEN GOODS:
These are such inferior goods, that even if their price decreases, their demand also falls.
EXPECTATIONS OF CHANGE IN PRICE:
If households expect a (change in price) increase in the price of a commodity in the future, the demand for such goodwill increases at that particular time. The law of demand fails to apply in such a case.
BASIC OR NECESSITY GOODS:
Some goods like milk for babies, medicines, etc. are such necessity goods, consumption of which cannot be avoided or reduced. Such goods are demanded irrespective of the change in their prices. An increase or decrease in the price of such a good does not affect its quantity demanded.
DETERMINANTS OF DEMAND

An organization should properly understand the relationship between demand and its determinants to analyze and estimate the individual and market demand of a commodity.
- Price of a product:
It affects the demand to a very large extent. There is an inverse relationship between the price of a product and its quantity demanded.
EXAMPLE:
Consumer prefers to purchase a product in large quantity only when its price is less.
- The income of the Consumer:
It constitutes one of the most important determinants of demand. The income of a consumer affects his/her purchasing power, which, in turn, influences demand a product. An increase in income would increase demand for products by him/her, while other factors are constants and vice versa. This income – demand relationship can be analyzed by grouping, goods into: –
- Essential or basic consumer Goods.
These are goods consumed by everyone (oil, soaps, food grains, clothes, etc.). The quantity demanded of such goods increases with an increase in income of consumers, but up to a fixed limit, while other factors are constant.
- Normal Goods:
The demand for these goods increases with an increase in income. For example, a consumer would prefer to purchase wheat and rice of millet with an increase in income. (Millet will become inferior for the consumer). However, both of these can be normal goods for low-income consumers.
- Inferior Goods:
The demand increases with an increase in income. Goods like vehicles and food items are demanded relatively increasing in qty with an increase in income.
- Luxury Goods:
The demand increases with an increase in consumer’s income. Luxury goods are used for pleasure and esteem of consumers. For example, expensive jewelry items, luxury cars, antique paintings, etc.
- Tastes and Preferences of consumers:
These play a major role in influencing individual and market demand of a product. These are affected due to lifestyles, customs, common habits, changes in fashion, etc. Change in such factors changes tastes and Preferences, and thus, consumers reduce consuming old products.
- Price of Related Goods:
The demand for a specific good is affected by the price of related goods.
Substitute Goods
These goods satisfy the same needs of consumers at a different price. Example tea and coffee, Jowar and bajra, etc. An increase in the price of goods increases demand for its substitute.
- Complementary Goods
These are consumed simultaneously or in combination; like pen and ink, cal and petrol are used together. These goods are inversely related to each other. An increase in petrol will decrease the demand for cars.
- Expectations of consumers
Expectations of consumers about future changes in the price of a product affect the demand for that product in the short run. For example, if consumers expect that the price of petrol would rise in the next week, the demand for petrol will rise in the present. On the other hand, consumers will delay the purchase of products whose price is expected to fall in the future.
EXPANSION & CONTRACTION

- A variation in demand implies extension or contraction of demand. A change in demand due to change in price is called extension or contraction of demand.
- It is a movement along the same demand curve due to changes in price.
- The diagram depicts that demand increases from a to b and then decreases to point c indicating various changes to demand due to price change.
INCREASE & DECREASE IN DEMAND

- Changes in demand are a result of a change in conditions/factors determining demand other than price.
- Change in demand thus implies an increase or decrease in demand with price remaining constant.
- An increase/decrease in demand signifier, either more or less, will be demanded at a given price. This is represented graphically by a shift in the demand curve (rightward in case of an increase in demand leftward in case of a decrease in demand).
- Changes in income tastes, and preferences, the demand for substitute & complimentary goods, etc. are some causes.
CONCLUSION
The study of demand is highly essential in today’s scenario, both for the consumers and the producers. For consumers, it’s necessary as through this, they can know the worth of the product they are willing to buy, hence, helps them to attain an equilibrium using their resources more efficiently.
For producers, it is important to know this because they can produce according to the demand and price of the product in the markets, cope up with the changing tastes of consumers, hence, helps in achieving producers’ equilibrium by maximizing profit.
NOKIA CASE STUDY
INTRODUCTION
![]()
Nokia is a Finnish multinational telecommunication, information technology, and consumer electronics company founded in 1865. Nokia’s headquarters are in Espoo, in the greater Helsinki metropolitan area. In 2017, Nokia employed approx. One hundred two thousand people across over 100 countries, did business in more than 130 countries and reported annual revenues of around € 23 billion. Nokia is a public limited company listed on the Helsinki Stock Exchange and New York Stock Exchange. It is the world’s 415th largest company measured by 2016 revenues according to the Fortune Global 500 and is a component of the Euro Stock 50 stock market index.
NOKIA’S DEMAND OVERVIEW
- Nokia creates differentiation in devices based on different price point segments.
- Pricing is heavily dependent on competitor prices, e.g., the smartphone segment typically has a price bracket.
- Demand is different for different device segments depending upon geographical region, local taxes, distribution chain, etc.
- Marginal Revenue for a smartphone (high segment) is greater than a low-end phone.
NOKIA: DEMAND CURVE
- Nokia shipped 83.7 million handsets worldwide in Q2 2012, down – 5% annually but up + 1% sequentially.
- The demand curve for mobile phone handsets is expected to grow even more in the future.
- Typical demand curve of Nokia looks like:
- Nokia tries to capture multiple price points on the overall demand curve of mobile phones.
- The different price points are used for differentiation among mobile phones for a targeted set of consumer segments.
- EXAMPLE: 600€ phone is a smartphone for developed markets, and 100€ phone is a low-end feature phone for growing markets.
NOKIA: DEMAND FACTORS
- Demand for Nokia phones depends on the following factors:
- The price point for each phone.
- Price of substitute goods (e.g., laptops, PDAs, tablets, etc.)
- The level of advertising expenditure
- Price of complementary goods (e.g., accessories, etc.)
- Customers’ disposable income.
- External microeconomic factors (e.g., inflation, IT boom, etc.)
- Consumers’ tastes and preferences
- Changes in population.
- Consumers’ expectations.
- Cost and availability of credit.
DEMAND ANALYSIS OVERVIEW
Following are necessary for demand analysis of mobile phones of Nokia:
- Sales forecasting
- Production planning
- Cost analysis (per segment) and Financial planning
- Pricing strategy
- Advertising costs
- Resource and Inventory Management
DEMAND
The demand curve is downward sloping
Demand is the consumer’s desire and ability to buy a good or service
According to the law of demand, when the price of a commodity increases, the demand for it will decrease.
CERTIFICATE
This is to certify that the present project report is the outcome of my efforts, and my indebtedness to other works/publications has been duly acknowledged at the relevant places.
It had not been submitted in part or full for any other diploma or degree of any University.
Teacher’s Examiner’s
Signature Signature
ACKNOWLEDGMENT
I am very thankful to my economics teacher, who helped me in analyzing the Topic – DEMAND. It made my concepts clear, enhanced my knowledge and helped me realize the importance of the Same
I am also thankful to CBSE for giving me an opportunity of doing this project and giving suitable guidelines to prepare the project.
DOWNLOAD PDF OF THE PROJECT

Password: hscprojects.com
In order to download the PDF, You must follow on Youtube. Once done, Click on Submit
Follow On YoutubeSubscribed? Click on Confirm
Download Economics Project on Demand CBSE Class 12 PDF