Business Studies Project on Import and Export
Download Business Studies project on Import and Export for CBSE class 12
INTRODUCTION
The process of trade liberalization and market-oriented numerous economic reforms that had studied in the early 1980s intensified in the 1990s. During the past 15-years, the Indian economy has become substantially more integrated into the world economy. The focus of these reforms has been liberalization, openness, transparency, and globalization with a basic trust in outward orientation and on export promotion. The philosophy behind economic reforms was that the role of govt. In deciding on resource allocation should be minimized. It was prophase that this would lead to the upgrading of production structure, facilitated by imported technology and improved skills enhanced by trade. It is asserted that trade liberalization would help the diversification of the structure of export, import in favor of manufactured goods. This project seeks to explain are the probes in light of the external sector performance over the last few decades. The introductions part follows an evaluation of the main aspects of India’s foreign trade policy reform. The following section analyses the trends and patterns of exports, imports, and the direction of trade.
POLICY CHANGES IN 1991

The inward-looking policy resulted in limited Indian participation in world markets. It resulted in a high level of protection to domestic industries with an anti-agricultural bias and paid little attention to export-led growth. The collapse of the world’s leading centrally planned economy of the USSR undermined India’s faith in the inward-looking policies followed until 1990. The political developments and the gulf crisis in 1990-91 in the contract of fragile BOP situation cultivated in a payment crisis of unprecedented dimension in the first quarter of 1991-92. A high rate of inflation much above 101 raised serious concerns on the macro-economic stability of the Indian economy. The gross fiscal deficit had grown up to 10 percent of GDP. The current account deficit increased to the time of 3.2 percent of GDP in the 1980s reached almost 60% in the 1990s. Large scale withdrawal of NRI deposits in the expectations of an imminent devaluation made the economy highly vulnerable to external shocks. India faced fiscal insolvency. All these factors helped the reform policies to be politically acceptable. The fear of being left behind China, which presented sustained record since its 1978 economic reform, made reforms scalable. The new government promptly took corrective steps to restore international confidence and announced a comprehensive adjustment package involving exchange rate, adjustment, fiscal correction, structure reforms. The rupee was devalued by 22.8%. Various budgets and export-import (EXIM) policy announcements since the 90s carried forward the trade policy reforms. These measures liberalized India’s trade regime by eliminating rupee on intermediate or capital goods imports and lowering tariffs. The rupee was made fully convertible against the current account in 1993. The multilateral commitments of the country to WTO, along with the unilateral policy initiates, facilitated greater integration of the domestic economy with the world economy. Numerous incentives to encourage FDI have been undertaken. The five-year EXIM policy for 1992-97 was announced in March 1992 to stimulate exports and facilitate imports of essential inputs as well as capital goods. SEZs were designed to overcome the limitations of export promotion zones (EPS) and to attract foreign investments to India. The govt. announced a new foreign trade policy (FTP) for the period 2004-09. The main objective of this policy is to double India’s percentage of global merchandise trade.
INDIA & GLOBAL TRADE
India’s exports and imports were US $18.14 billion and the US $24.07 billion, respectively, in 1990-91. Exports reached the US $177.5 billion in 2008 to become 27th leading merchandise exporter and imports and reached the US $293.4 billion become the 16th leading merchandise importer of the world India’s share in world merchandise exports, after rising from 0.5% in 1990 to 0.8% in 2003 reached 1.1% in 2005. This increase due to the rise in India’s exports growing at more than the rate of growth of world exports since 2005 its significant export growth in the first-rate decade of the 21st century was on account of a host of favorable external developments. Trade-in services have been growing at a faster rate than merchandise trade. The share of trade services in total external trade increased from 21.5% in 1990 to 27.4% in 2006. India’s total services exports stored at US 102.6 billion as per the latest exports to become 9th leading service exporter, with a share of 2.7% of world service exports. India ranks 13 among leading service importers with a share of 2.4% of the world’s services exports. Total service imports amounted to US $23.6 billion, which includes software, bisects, financial communication services.
EXPORT-IMPORT TRADE BALANCES AS PERCENTAGE OF GDP
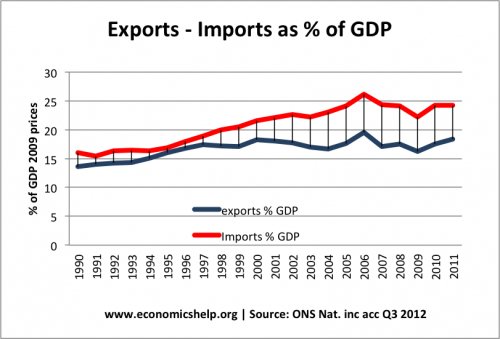
The index of openness of the Indian economy, measured as the ratio of foreign trade to GDP, increased from 13.4% in 1990-91 to 39.7% by 2008-09 through fluctuation may be observed in between. Both exports, import as a percentage of GDP have increased during the post-reform period. In the crisis year, 1991-92, exports as percentage GDP was 6.7 and that of imports was 77 leading to a trade deficit of 1%. The share of exports in GDP reached 8.9% in 1995-96 from its level of 5.8% in 1990 to 91. 2009 – 10 exports as a percentage of GDP stood at 13.4 and that of imports at 21.2, leading to trade deficit of 7.8%. India’s import to GDP ratio, which rose sharply from 1.2% in 1991-92 to 12.3% in 1996-97, has marginally declined to 11.5% in 1980-99. Since then, it had reached 11.5 in 1998-99. Since then, it has reached a record 24.7% in 2008-09 due to economic slowdown. The high growth in imports in value terms was primary due to high oil prices. The overall growth of trade also created a potential economic problem with a growing trade deficit. This may reflect a bag between export growth and growth in the import of capital, intermediate, basic goods.
GROWTH RATE OF EXPORT & IMPORTS
India’s exports grew substantially during the 19s when they saw in terms of absolute values or relate to the GDP. Since the introduction of economic reforms, India’s export has risen from the US $18,142. 84 million in 1991-92 to US $185,925.2 million in 2008-09 before subsiding to US $1765 million in 2009-10. The export growth has been uneven, while during 1993-96, it recorded impressive gains; the annual growth rate fell sharply in 96-97 and even turned negative later on. Again, exports staged substantial recovery and recovered on the average growth of 29.1% in 2002-03, 2008-09. There is an increasing contribution of higher unit values in recent years, as reflected in the net terms of trade. This change to the incident with the rising share of high-value gems and jewelry items, a gradual shift to garments from fibers and fabrics, and the sharp rise in prices of nonfuel primary items like ores and minerals, iron and steel, and non-ferrous metals. Though the high growth input and demand, especially in a major trade, collaborate of India, helped it was the pick-up in the domestic economic activities, especially the constant near double-digit growth in manufacturing that constituted the chain of the recent export.
Merchandise imports grew from US $24,072.5 million in 1990-91 to US $303,696 million in 2008-09 before declining to US $ 278,681 million in 2009-10. While India’s total import bill in dollar terms rose consistently through the 1990s starting from its 1991-92 level, the rate of growth has decelerated since 1996.97. It again picked up from 2002-03. There is of lower on a good reason to expect a deceleration in import growth after 1995-96, and this is the deceleration growth rate after 1995-96, and this is the deceleration level. Again, industrial growth accelerated since 2003-04, and imports followed suit. Imports declined by 82% in 2009-10 in response to the global slowdown. Thus, output movements in the industrial sector dependent on imports for capital equipment, intermediates, and components, substantially explain movements in India’s import bill as well. During the period 1990-99, both export, imports grew at an average annual rate of 39%. However, in the 21st century, exports grew at an average rate of 17.61 and imports at 19.9%. Total trade grew at the average annual rate of 39.8% in the 90s. The growth rate has fallen to 19-9% in the first decade of the 21st century with the growth of total trade. Because the 80s were export lead, both export and import equally contracted, but in the current growth, mainly import lead.
COMPOSITION OF IMPORTS & EXPORT
The structural change in the composition of export in lagging behind the structural change in the composition as GDP unit of India’s economic growth has been the result of the expansion of its service sector. The share of manufacture in GDP has remained disappointingly feat. At 16.3% GDP, the share of manufacturing in 2006-07 was still below 16.7% level of 1990-91. In contrast, the share of services has risen steadily during this period, from 44% to 55%. However, its share of services in total external trade increased from 15% in 1990 to 27.4% in 2006. Among the commodity groups, most products contributed 23.83% of India’s exports in 1990-91. Then, its share has fallen to 17.72% in 1990-2000 and further to 13.9% in 2008-09. However, the share of manufacturing goods, which was 71.63 in 1990-91, has reached 80.7% in 1999-00, but thereafter, it fell to 70.39% in 2005-06 and further to 66.2% in 2008-09. However, the share of petroleum products increased from 2.88% in 1990-91 to 17.4% in 2007-08 before dropping down to 14.7% in 2008-09.
EXPORTS COMMODITY BASKET
India’s export basket has diversified in the past five years with engineering good, petroleum products, and chemical products increasing their share in export basket, while traditional exports like textiles, gems and jewelry, and leather products losing their shares. In 1990-91, the major items of exports were Textile (23.93%), Agriculture and food, products (18.49), gems and jewelry (16.12%), engineering good (12.40%), chemicals and related products (12.4%), etc. Petroleum & crude oil, gems, pearls were major items of exports declined steeply in case of leather and leather manufacture, and to a smaller extent in case of handicraft. Since these products were reserved for production by small scale industries, with either was not competitive or could not expand, risen if competitive, given the reservation policy, the decline in the share of these products in incremental exports is not surprising. Despite the never opportunities that opened up with the phasing out of textile quarts, textile exports in total exports showed a declining trend. In textiles, with the quarts regime giving way to free-market at the global level at the beginning of 2005, these are lots of expectations from this industry.
IMPORT COMMODITY BASKET
Among the commodity groups of import, petroleum, crude oil, and other products (POL) constitute major items of import in 1990-91 as well as 2014-15, though its share in India’s total imports has increased from 25.04% in 1990-10 to 31.3% in 2014-15. Export of bulk consumption goods consisting of agriculture commodities such as cereals, pulses, edible oil, sugar that were imported to meet domestic supply shortfall; and other bulk items mostly non-supply shortfalls and raw materials and intermediates such as which constituted 2.31% of India imports in 1990-91 packed at 5.95% in 1998-99 but subsequently fallen to 2.79% in 2004-05 and further to 2.1% in 2014-15. In 1990-91, major imports included petroleum, crude, and products (25.04%), and other commodities (23.82%) machinery except for electrical electronics, pearls, precious and semi-precious stones. Project goods, inorganic chemicals, iron & steel, oil continues to top import items, and over three-quarters of its oil imports are crude oil. Jewelry remains India’s second-biggest import, consisting of merely an equal amount of gold and diamond to be used by India’s jewelry manufacturing industry. The next two important categories, machinery, electrical machinery, incorporates both commodities ad intermediate goods.
DIRECTION OF TRADE
Among India’s individual trade partners (exports + imports), the USA was the largest trade partner accounting for 13.26% of India’s total trade in 1990-91. In 2008-09, UAE, with a share of 99.9%, was India’s largest individual trade partner, followed by China, USA. The emergence of Dubai as world trading for net exports competed with high oil prices, as India import not only crude oil from but also exporting refined POL products, UAE has emerged as the largest trading partner of India. Russia & Japan were the 2nd and 3rd largest trade partners in 1990-91 and are not among the top ten trade partners of India in 2006-07. China has emerged as the second-largest trade partner accounting for 8.6% of India’s trade-in 2008-09. With the collapse of the Russian empire, barter trade arrangements with that region collapsed as well. This led in the post-reform era to a declining share of Eastern Europe in both imports and exports. In the 1990s, more than half of India’s exports were directed towards O&CD markets, with 2.8% directed to all markets, and around 15.1 to the US, around 16.1% went to Russia. In 1990-91, US was the major source of trade (6.71%), UK (6.70%) imports from EU were 2.9% in 1990-91, and that from North America were (13.44%) In 2013-14, there was growth of imports & exports to North America (9.1%) and Africa (7.2%) and low growth to Europe (4.1%) and Asia (1.1%) and negative growth to Latin America (-20%) and the C/S and Baltics (-4.7%) while export growth to the US was 8.3%, it was just 2.2% to the EU (2.7%) as a result of slowdown in the EU. Exports to the UAE fell to a negative -16% exports to Asia still constitute around 50% of India’s exports. While India’s exports to ASEAN (Associates Of South East Asian Nations) grew by a small 0.5% exports to South Africa grew robustly with high growth to all the four major SAARC countries, Sri Lanka, Bangladesh, Nepal, Pakistan, besides Bhutan. There was also good export growth to Chine, Japan at 9.5% and 11.7% respectively. Region-wise, imports from all five regions declined with the highest decline of – 19.3% in imports from Europe. The share of Top 15 trading partners of India’s trade at 58% in 2013-14 was more or less the same as in earlier years. The top these three buildings partners of India are Chine, USA, UAE with top slot shifting between the three export-import ratios reflecting bilateral trade balances show that among its top 15 trading partners, India has bilateral trade surplus with four countries, namely USA, UAE, Singapore, Hongkong in 2013-14 with high increase in export-import ration with the USA.
EXPORT PERFORMANCE OF INDIA & EDE’S
The Share of emerging and developing countries (EDE’s) in the world merchandise exports has increased from 25.4% in 2000 to 42.3% in 2012. Nearly 60% of this increase is one account of BRICS (Brazil, Russia, India, China, South Africa) countries whose share increased from 1.6% to 10.1% within BRICS. The largest increase is in China’s share, followed by Russia, India, Brazil. The share of four new industrial and Asian Economics (NAAEL) has fallen by 1.1 points. This is mainly on account of the widely higher CAGR of the EDE’s at 13.9% during 2009-10 compared to the NIAEs at 8.4%. This was in sharp contrast to the 1990s when the export growth of NIAEs was higher than that of EDE’s. The tectonic shift in trade share in 2008s and early 2010s is mainly on account of China’s trade, which also witnessed the highest growth rate of 20.3% and to a lesser extent, the three BRICS countries Russia, India, and Brazil. While in 2012, the growth rate of most of the EDEs and NIAEs except China and Mexico were low & negative in 2013, only China, which is followed by India with near 5.1%, had good growth. As per the WTO data, export and import growth rates in the first quarter of 2014 were low or negative in the case of China, Australia, Russia, the USA, and Hongkong.
RECENT TRENDS
There has been a paradigm shift in India’s export and import pattern from developed countries of the USA and Europe towards the developing markets. The main reason for this shift is slowdown or recession in the USA and European markets. India’s share of imports from European countries fell to17.32% in 2012-13. This share earlier stood at 19.32% in 2009-10, and the same is true for India’s import from the US, which has decreased to 49.4% from 5.89% earlier, according to x-m data India. India’s export of goods fell by 1.76 in 2012-13 to around $301 billion, while its impact grew by 0.44% to 491 billion.
The main reason is India’s imports are due to restricting global restriction production due to which supply chains have been moving eastwards. Even the share of countries like South Africa & Australia in India’s falling due to India’s ability of most of its demand for gold for Switzerland share of India import from countries such as Kuwait, Qatar, Venezuela has gone up because of its importing petroleum products from the countries which it was earlier sourcing from Iran demand for transport equipment, machinery, iron and steel and products.
PRINCIPAL COMMODITIES OF INDIA EXPORTS
-
Plantation Crops
The exportation of plantation crops during 2011-12 increased by 39.29% of US $ terms compared with the corresponding period of the previous year. Export of coffee registered a growth of 77.50%, the value increasing from the US $313.53 million to the US $556.52 million. The export of Tea also increased by 9.34%.
-
Agricultural & allied products
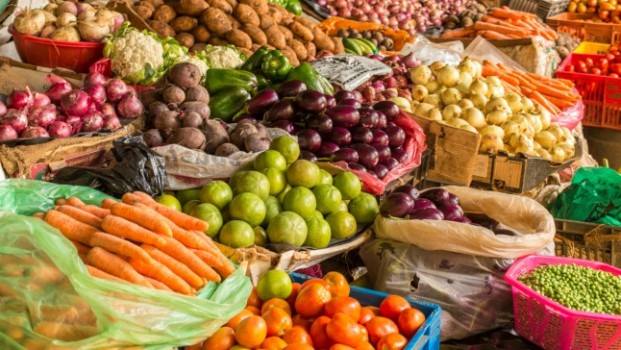
Agricultural and allied products as groups include cereals, pulses, tobacco, spices, nuts, seeds, oil, meals, guar gum meals, castor oil, etc. During 2011-12, the export of commodities under this group registered a growth of 62.9%, with the value of exports increased from the US $ 8165.3 million in the previous year to the US $ 13300.62 million during the current year.
-
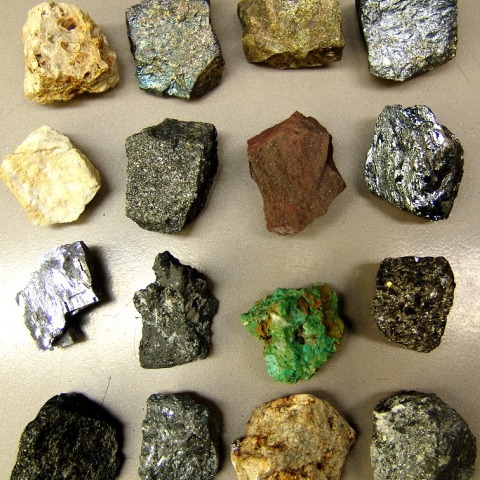
Ores and Minerals
Exports off ores & minerals were estimated at the US $ 47700.29 million during 2011-12 registering a negative growth of 8.32% over the same period of previous year subgroups viz processed minerals, Iron ore has recorded a negative growth of 35-76% and other ores and minerals 78.37% respectively mica has registered a growth of 5.74%.
PRINCIPAL COMMODITIES OF INDIA’S IMPORTS
-
Fertilizers
During 2011-12, import of fertilizers decreased to the US $ 4413.85 million from the US $ 4695.51 million in 2011 negative recording growth of 6%

-
Petroleum Crude & Products
The import of petroleum crude & products stood at the US $ 85002.32 million during 2011-12 as against the US $ 58175.62 million during the same period registering a growth of 46.11%.
-
Pearls, Precious Stones
Imports of pearls and precious, semi-precious stones during 2011-12 increased to 1718.745 million from the US $ 16907.33 million during the previous year, registering marginal growth of 1.66%.
-
Capital Goods
Import of capital goods largely comprises of machinery, including transport equipment and electrical machinery import of machinery and transport equipment registered a growth of 43.24%, 26.87%, 26.39%, 8.74%, respectively.
INDIA’S SERVICE TRADE
In commercial services trade, India was the sixth-largest exporter with a 3.4% share of the world’s largest exports and seventh-largest importer with 3.1 shares of world largest imports in 2012. The 2008 global financial crisis gave a big fact to India’s services exports. In the five years before 2008, service export growth (CAGR) at 35.4% was faster and way above the merchandise export growth at 25.8%. In the five years post, crisis service, export growth stood 80.3% below 12.8% merchandise export growth. In 2012-2013 service exports at the US $ 145.7 billion showed a lower growth of 2.4% compared to 14.2% in the preceding year. They improved slightly in 2013-14 with a 4% growth the same as merchandise export growth while export of software services with 45.8% share and non-software with 29.1% share grew by 5.4% and 5.9%, respectively, all other major categories and grew by a small 3.2% in 2012-2013. Net services have been a major course of finance India’s growing deficit in recent years on an average during 2006-07 of the merchandise trade deficit in 2013-14.
WORLD TRADE SCENARIO
As per IMF’s world economic outlook 2013, world trade recorded its largest-ever annual increase in 2012, as merchandise exports surged 14.4%. The volume of trade in 2013 slowed down to 7.5% compared to 12.5% in 2012. Growth in the volume of world trade declined to 5.8% in 2013 as per IMF projections. The IMF moderated its growth projections of world output to 4.1 in 2012. The advanced economies are expected to grow at 3.1 in 2015 while emerging economies to grow at 7.1%. The projected growth rates in different countries are expected to determine the market for exports. India is the 20th largest exporter in the world, with a share of 1.4% and 13th largest importer with a share of 2.1% in 2011. The year 2011 has been a difficult year with Japan facing major disasters, the swelling of unrest in the middle east oil-producing countries, the slowing down of the US economy, and the Euro area facing major financial turbulence. As a result, India’s short-term growth prospects have also been impacted.
ACKNOWLEDGMENT
I, of class XII – C, am highly interested in my esteemed Business Studies teacher Mrs. Daljit for her rich knowledge and experience invaluable guidance constant supervision and constructive suggestions, which she had been patiently importing to me and without her help, the completion of the present project work would not be possible
CERTIFICATE
This is to certify that Sahibvir Singh of class XII-C of Guru Gobind International Public School has completed his project work under my guidance. He has taken proper care and has shown utmost sincerity in the completion of this project. I certify that this project is up to my expectations and as per the guidelines issued by CBSE.
Mrs. Daljit
CONCLUSION & OBSERVATIONS
The post reforms period witnessed significant changes in the trend, pattern, and structure of India’s external trade. The assertion that trade liberalization would help the diversification of the structure of exports, output in favor of manufactured goods has not materialized. The change in the pattern of specialization in exports is more or less in conformity with a change in the pattern of production. The growth of services was more pronounced in GDP growth and is a reflection in the increasing share of services in exports. While volume growth dominated export performance until 2002-03, there is an increasing contribution of high-volume units in the 2000s as reflected in the net terms of trade. India is not able to get full benefits from the removal of NPA. To sustain a higher growth rate while making Indian Industry competitive. India will have to try and achieve minimum damages a robust growth in its exports by expanding its share.
DOWNLOAD PDF OF THE PROJECT

Password: hscprojects.com
In order to download the PDF, You must follow on Youtube. Once done, Click on Submit
Follow On YoutubeSubscribed? Click on Confirm
Download Business Studies Project on Import and Export PDF